Case study
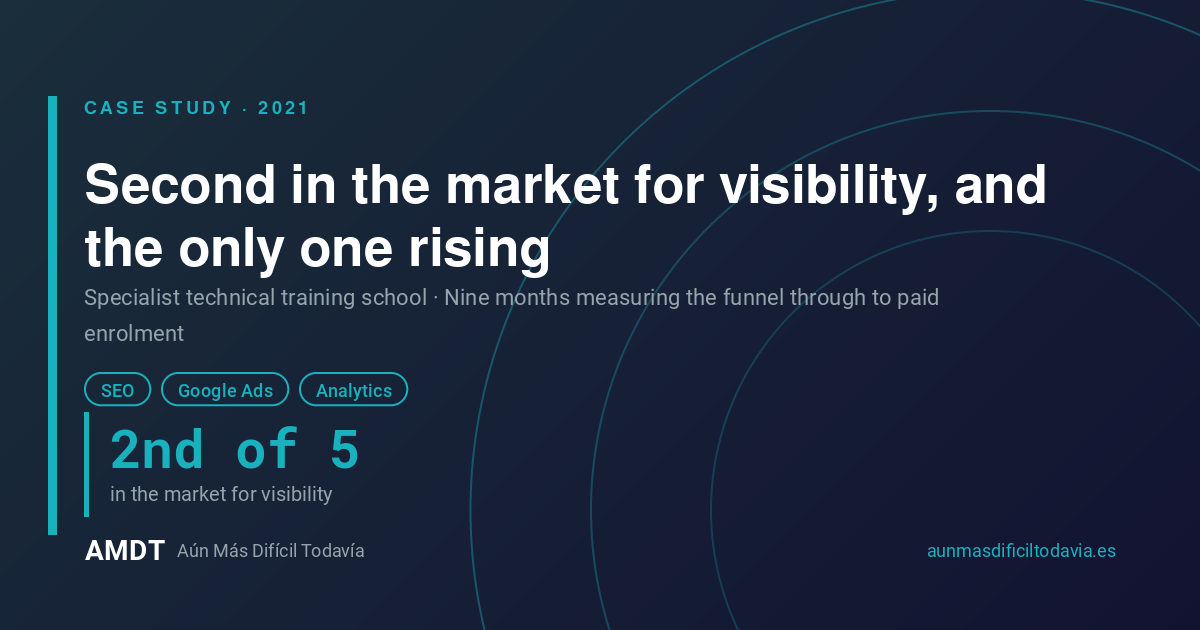
Second in the market for visibility, and the only one showing growth
Specialised technical training school · Nine months tracking the funnel through to paid enrolment
In specialised training, the major competitor almost always wins by default: they’ve been publishing for years, have more links and greater brand recognition. That’s why the useful question isn’t ‘when will we overtake them?’, but ‘are we getting closer or further away?’.
In the January 2022 closing report, this client ranked second out of five in desktop visibility in its market — 13.01 per cent compared to the leader’s 15.07 per cent — and was the only one of the five to see an increase in visibility on both desktop and mobile in the most recent measurement period.
Let’s begin:
2nd out of 5
in the market for visibility
3 → 16
enrolments per month
4.61% → 5.97%
CTR of the main campaign
9 of 12
organic channel purchases
1. The project
This was a technical training centre with a physical location and its own classrooms, an official certifying body for a software manufacturer, with two lines of business: in-person training broadcast live and an online series of short training modules launched in June 2021. Its shop operated on a content management system with an e-commerce module.
The project lasted nine months, from April 2021 to January 2022, and had a rare strength: the funnel was tracked right through to the transaction, not just to the form submission. Let me explain 🙂 With a high-ticket product involving a slow decision-making process, intermediate conversion rates can be very misleading, which is why we tracked the journey all the way to the paid enrolment.
2. What we did
Project timeline:
- April 2021 — initial audit: full site crawl and organic ranking analysis across 350 search queries.
- May — redirect plan and in-house crawl.
- June — comprehensive SEO analysis, analysis of the course catalogue and digital analysis of the competition.
- 1 July — launch of the first two advertising campaigns: one for the online programme and the other for the main programme.
- August — launch of email, remarketing and course campaigns.
- September — keyword analysis for the blog.
- November — step-by-step analysis of the sales funnel, from the course listing to the transaction.
- January 2022 — project closure with a final report, a report on negative keywords and an export of redirects.
3. The results
How did the sales funnel perform?
| Month | Product page | Trolley | Checkout | Transactions |
|---|---|---|---|---|
| July 2021 | 38 | 24 | 7 | 3 |
| August 2021 | 297 | 17 | 13 | 5 |
| September 2021 | 209 | 48 | 33 | 11 |
| October 2021 | 195 | 147 | 63 | 16 |
| November 2021 | - | - | - | 10 |
| December 2021 | - | - | - | 12 |
Funnel analysis series for 19 November 2021. October includes the change in payment gateway, as noted in the file itself. November and December are taken from the corresponding monthly report.
And what about visibility compared to the competition?
| Competitor | Desktop visibility | Change | Mobile visibility |
|---|---|---|---|
| Market leader | 15.07% | −0.12 | 13.46% (−0.57) |
| The client | 13.01% | +1.56 | 11.44% (+1.02) |
| Third competitor | 9.36% | −0.54 | 7.03% (+0.95) |
| Fourth competitor | 2.53% | +0.71 | 2.15% (−0.14) |
| Fifth competitor | 1.38% | −0.26 | 1.59% (+0.11) |
Closing report dated 7 January 2022, covering 239 keywords on desktop and 247 on mobile, Spanish market. The client is the only one of the five to have improved its visibility on both devices during the period.
At the close, the site ranked first for brand searches and for several product searches — including the expert-level course within the main programme — third for searches for the official master’s degree, and had climbed thirty-six places for a technical term used in the sector.
4. The finding that only emerges when tracking through to payment
It’s clearly worth mentioning, which is why it has its own section: sales weren’t coming from advertising.
In December 2021, the business recorded twelve purchases. Nine came from organic traffic and three from direct traffic. None came from the paid campaigns active that month.
I recommend asking yourself the same question about your account: if you were to switch off the adverts tomorrow, how many of your sales would still come in? The answer only becomes clear when you track right through to the transaction, and it often changes the budget for the following year.
To sum up: who are you comparing yourself against?
Essentially, against yourself from last month and against the four competitors next door. Both, and in the same table.
Here are three suggestions. Firstly, set up a dashboard featuring your actual competitors: your own performance without context means nothing, and a +1.56 could be a huge victory if the others are falling behind. Secondly, measure the funnel right through to payment, because intermediate conversion rates can be very misleading. And thirdly, break down performance by channel before renewing your advertising budget: you might be paying for something you were already getting for free.
Remember, at the end of the day, it’s all about whether you’re getting closer or further away 😉

