
Case study
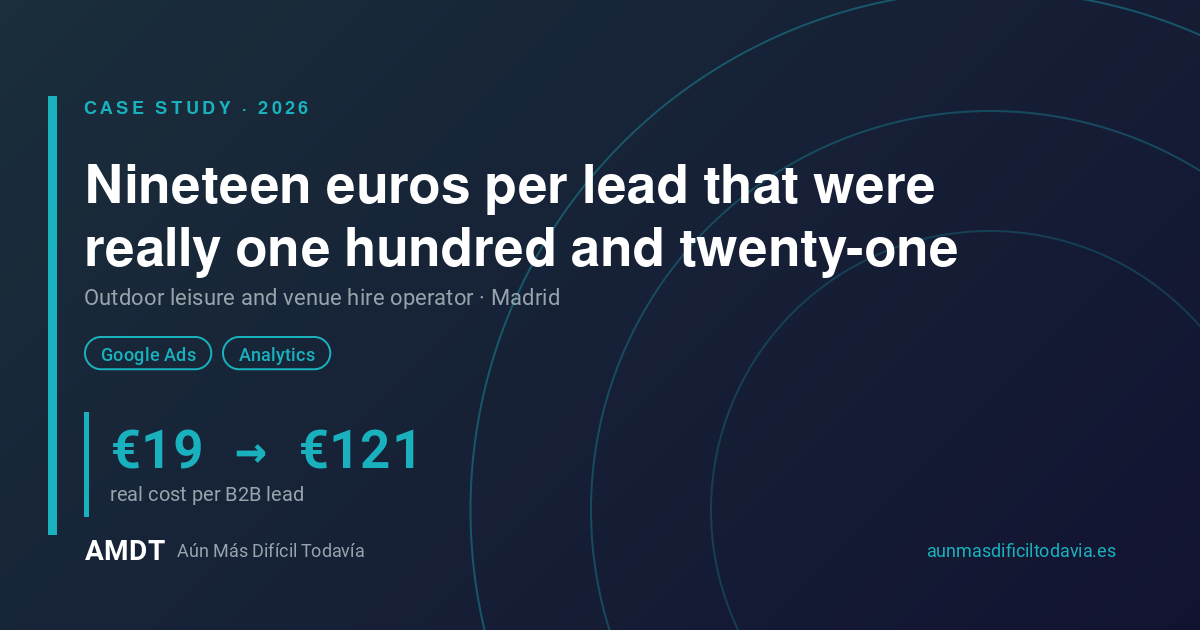
Nineteen euros per lead, which was actually one hundred and twenty-one
Outdoor leisure operator and venue hire · Madrid · What the Google Ads dashboard says versus what happens at the till
March 2026. The client’s Performance Max campaign showed around 32 conversions in the Google Ads dashboard, with an investment of 608 euros. That’s around nineteen euros per sales lead. An excellent result for a business renting out venues for corporate events.
Upon closer inspection, of those 32 conversions, around 27 were cinema ticket purchases and only about 5 were genuine B2B leads. The true cost per lead was not 19 euros. It was around 121.
The campaign had been optimising towards the wrong objective for months. And nobody had noticed, because the dashboard said everything was going well.
Let’s not confuse apples with pears: a conversion isn’t just a number; it’s a business event. Let’s begin:
€19 → €121
unique keywords ranking
#1
domain most frequently cited by Google’s AI
9
Errors identified in a rival audit
2.7 M
organic impressions in 90 days
1. The context: two businesses within the same website
The client isn’t just one thing. It’s a drive-in cinema selling tickets to the general public; a covered venue hired out for concerts, corporate events, film shoots and catering; and its own events agency. A B2C business and a B2B business sharing a domain, website template and analytics platform.
It is precisely this coexistence that gives rise to measurement errors.
The starting point, with data from March and April 2026:
- 64,349 clicks and 2.7 million impressions over ninety days, with a CTR of 2.38% and an average position of 10.4 (Search Console).
- 79,273 organic sessions and 10,882 conversions over the same period (GA4). There was certainly no shortage of volume.
- But over 85 per cent of searches were branded: people who already knew the client and typed in its name.
- The B2B pages for the events division were set to ‘noindex’ due to a configuration issue in the content management system. They were invisible to Google, without anyone realising it.
- The second domain – the one for the B2B business – had ‘noindex’ and ‘nofollow’ set on all its pages, with no H1 tags and empty meta descriptions.
- And a real gem: a content URL with a typo in the slug — including the typo — was ranking in 10th place for a term with 12,100 searches per month.
2. The key finding: conversions that weren’t conversions
How do you spot a problem that no tool picks up on?
By looking at which specific event the campaign is optimising for, not how many it triggers. Let me explain 🙂
Performance Max was training its algorithm on the ‘btn_comprar_entrada’ event — the purchase of a cinema ticket, worth a few euros — when the stated objective was ‘btn_organizar_evento’, the request for a quote to hire a venue, which is worth several orders of magnitude more.
The algorithm was doing its job perfectly. We’d asked it to do the very thing we didn’t want.
From there, the plan was divided into three phases: cleaning up the conversions, tidying up the secondary B2B domain, and migrating the campaigns to the correct structure. That’s why the first deliverable wasn’t a new campaign: it was a diagnosis of what was actually being counted.
3. What we did
The work carried out between February and July 2026:
- Keyword research and website architecture for the events section: 46 keywords and an architecture that evolved from fifteen pages to six, after we realised that ‘The Venue’ and ‘Hire’ were competing with each other for the same searches. Fewer, clearer pages. The identified target audience amounted to around 148,000 monthly searches.
- Complete Performance Max campaigns for two fixed-date events — two themed events with fixed dates —: fifteen short headlines, five long headlines, five descriptions, search topics, extensions and audience signals by ad group.
- A comprehensive ten-phase SEO audit covering 586 URLs, with two deliverables: the internal technical report and the ranking report for management.
- Diagnosis of the blank screen issue in Safari on iOS, reproducing the rendering in a real WebKit engine using a local mirror of 93 resources and 2.8 MB.
4. The counter-report: when a rival agency conducts an audit with the crawler blocked
In April 2026, an audit from another agency landed on the client’s desk. The verdict was damning: no indexing, no schema, no sitemap, no Core Web Vitals. Overall score: 31 out of 100.
It was all false.
What had happened was that the site’s application firewall was returning a 403 to that agency’s crawler, whilst Googlebot was crawling as normal. It’s clear that a tool that can’t gain access can’t carry out an audit: their crawler couldn’t see anything, and since it couldn’t see anything, they concluded there was nothing there. We documented the nine factual errors one by one and submitted the counter-report.
I recommend you bear this anecdote in mind for the next time you receive an alarming audit report from a provider seeking access to your account: the first thing to check is not the findings, but whether the crawler was able to gain access.
5. The results
| Finding or metric | Situation detected | Value to the business | Source |
|---|---|---|---|
| Actual cost per B2B lead | ~€19 apparent | ~€121 actual | Google Ads |
| Search (comparison) | 34 B2B conversions | €13.41 per lead | Google Ads |
| Competitor audit | 9 factual errors | Counter-report submitted | AMDT |
| B2B pages for the events sector | set to noindex | Detected and escalated | Screaming Frog |
| the second domain, the B2B business one | noindex + nofollow | 3-phase recovery plan | Playwright |
| Mentions in AI Overview | 98 | Most cited domain no. 1 | DataForSEO · est. |
| Core Web Vitals | all in the ‘fast’ range | Confirmed in the field and in the lab. | PageSpeed · measured |
| the top query for the category | Rank 1 | Brand-led top position secured | Semrush · est. |
The 98 mentions in AI Overviews place the client’s domain as the most cited within its set of queries, ahead of IMDb, Wikipedia and Netflix, based on an AI search volume of 86,700. This is a tool-generated estimate, not a one-to-one observation across the board.
A clarification we feel obliged to make. Between January and March 2026, the site’s organic CTR rose from approximately 1.3% to 3.1% and the average position from 12.8 to 7.9. This is a genuine improvement, as measured in Search Console, but our first recorded activity dates from 25 February: that trend predates or coincides with our involvement, and we do not present it as our own achievement. We mention it because it sets the context, not because we deserve credit for it.
To sum up: what is your algorithm optimising?
Basically, whatever you tell it to. And if your website combines two business models, there’s a strong chance you’re telling it the wrong thing.
Three checks to carry out first thing tomorrow morning. First, open your Google Ads account and see which conversion actions are marked as primary: not how many there are, but which ones. Secondly, if you sell tickets and also rent out venues, or if you have a low-ticket product and a high-ticket service, separate them into different actions or your campaign will always go for the cheaper option. And thirdly, and this is the most important thing, be wary of any audit — including ours — where the author doesn’t show you the response code obtained by their crawler.
Remember, at the end of the day, it’s all about what happens at the till, not what happens on the dashboard 😉

