
Case study
A cost per lead of 42 euros that fell to 12 in three months
Chain of laser hair removal centres · Two countries, over a hundred centres and a business model that needed to be made profitable city by city
A chain of physical centres faces a problem that an e-commerce business does not: a lead is only valuable if it comes from near a centre. An excellent enquiry form from a city where there is no clinic is not a lead; it is a cost disguised as something positive.
This client operated over a hundred centres in Spain and an expanding network in Italy. The advertising budget ranged from eleven to twenty-nine thousand euros a month, split between the two countries, and a decision had to be made on a city-by-city basis as to where it made sense to bid.
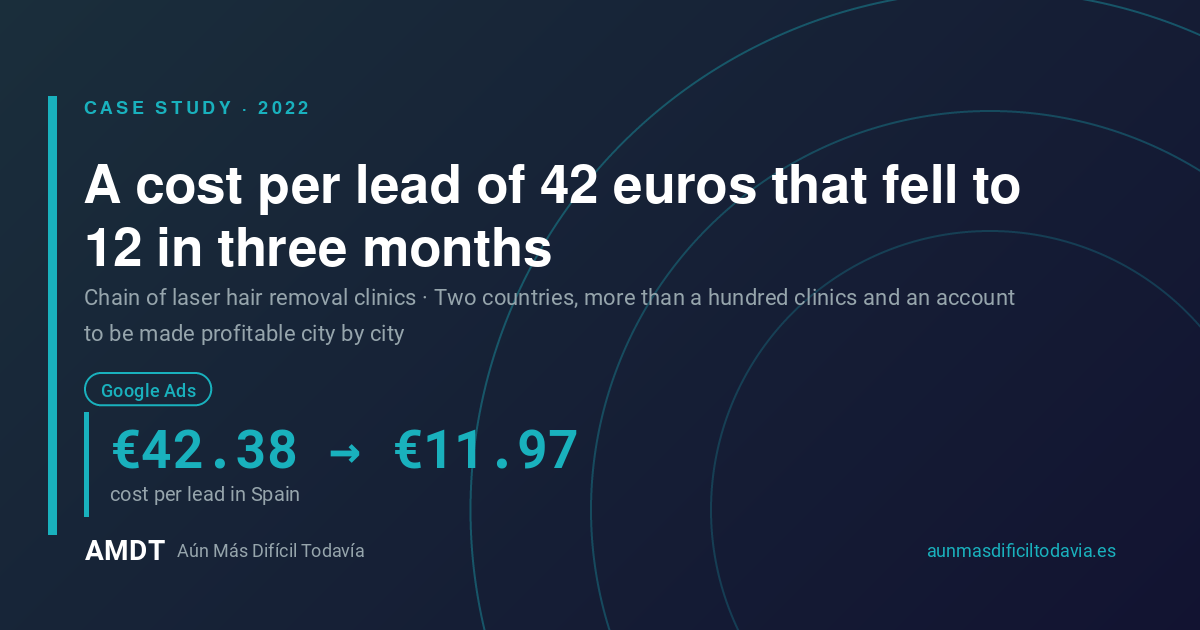
Between November 2023 and January 2024, the cost per lead in Spain fell from 42.38 to 11.97 euros. Let’s begin:
€42.38 → €11.97
cost per lead in Spain
7.41% → 10.54%
CTR in the same period
309 → 577
leads per month
€5.78
CPL for the campaign
1. The starting point
There isn’t a clear ‘before’ in this case, and it’s worth stating that from the outset. Let me explain 🙂 When AMDT came on board, the account was already up and running in both countries. What we do have is a continuous monthly series spanning sixteen months, from which we can see, with specific dates, which decisions led to which changes.
The snapshot for October 2023, the first month with a complete data series:
- Spain: 93,191 impressions, 6,999 clicks, a CTR of 7.51%, a CPC of €1.73 and 407.99 leads at €29.66 each.
- Italy: 42,078 impressions, 4,396 clicks, a CTR of 10.45 per cent, a CPC of €1.53 and 180.62 leads at €37.17 each.
- And a month later, in November, Spain’s performance worsened: the cost per lead rose to €42.38 with 309 leads. That was the actual low point from which the improvement began.
2. What we did: bidding where there’s clinical evidence
The key lever was geography. Therefore, the work did not involve writing better adverts, but rather using data to decide which cities were worth targeting.
The decisions shown in the series:
- Segmentation by city, with a dedicated budget for the two major cities and a campaign covering the rest of the country, each with its cost per lead monitored separately.
- Shutting down underperforming markets. The local tests were documented with their figures: one city in the north at €154.59 per lead, another at €301.36, and a third at €72.38. They were paused. There’s no glory in running a campaign that loses money just for the sake of it.
- A costly experiment was scrapped: a test segmenting by body area in one of the major markets spent €1,247.98 on two leads, i.e. €623.99 per lead. It was cut and the reason is on record.
- A seasonal Performance Max campaign during the Christmas period, which closed with 54 leads at €5.78 each: the best cost per lead across the entire series.
- Parallel management of the two accounts – Spanish and Italian – with a joint monthly report and a comparison between markets.
3. The results
| Spain | Nov 2023 | Dec 2023 | Jan 2024 |
|---|---|---|---|
| Account investment | €13,094.04 | €6,961.57 | €6,906.25 |
| Views | 93,723 | 87,729 | 84,445 |
| Clicks | 6,948 | 7,072 | 8,898 |
| CTR | 7.41% | 8.57% | 10.54% |
| Average CPC | €1.88 | €0.93 | €0.78 |
| Leads | 309 | 451 | 577 |
| Cost per lead | €42.38 | €15.44 | €11.97 |
Data from the Spanish account, measured in Google Ads. In three months, investment fell by 47% and leads rose by 87%. The improvement did not come from spending more: it came from stopping spending where there was no return and from a CTR that rose from 7.41% to 10.54%.
| Italy | Oct 2023 | Nov 2023 | Mar 2024 |
|---|---|---|---|
| CTR | 10.45% | 11.74% | 6.80% |
| Average CPC | €1.53 | €1.19 | €0.77 |
| Leads | 180.62 | 234.95 | 147 |
| Cost per lead | €37.17 | €29.54 | €20.34 |
The Italian account follows a different trajectory: lower volume and a cost per lead that falls steadily to €20.34 in March 2024, the best figure for the period. The CTR falls in the final stretch due to a change in the campaign mix.
This is also the only client in our entire historical portfolio whose records show a turnover figure attributed to marketing: 42,368.10 euros generated by a single month’s cohort of leads. This is data provided by the client, not our own estimate.
4. The discipline behind these figures
An account of this size is not managed on intuition alone. It is managed according to a set of written rules for each test: how much to allocate, for how long, and the threshold below which the campaign is paused.
That is why the series features paused campaigns with their cost per lead shown alongside them, rather than simply being omitted. When an experiment is paused without recording the figure that led to its suspension, six months later someone reopens it and the money is spent all over again.
It’s clear that saying ‘no’ to a location costs more than saying ‘yes’. I suggest you set that threshold before launching the campaign, not afterwards: decisions are much better made with a clear head.
To sum up: does your local advertising know where your shops are?
Basically, that’s the test. A chain with physical branches that bids the same across the whole country is paying for leads it cannot serve.
Three things I’d do tomorrow. First, I’d set a target cost per lead per city, not a single, overall figure: the national average hides the locations that are ruining the account. Secondly, I’d give each test an expiry date and a written cut-off figure, because without that, experiments never come to an end. And thirdly, I’d measure the cost per lead alongside the cost per customer who actually walks through the door, because the entire business hinges on the balance between the two.
Remember, at the end of the day, it’s all about bidding where there’s someone waiting on the other side 😉

