
Case study
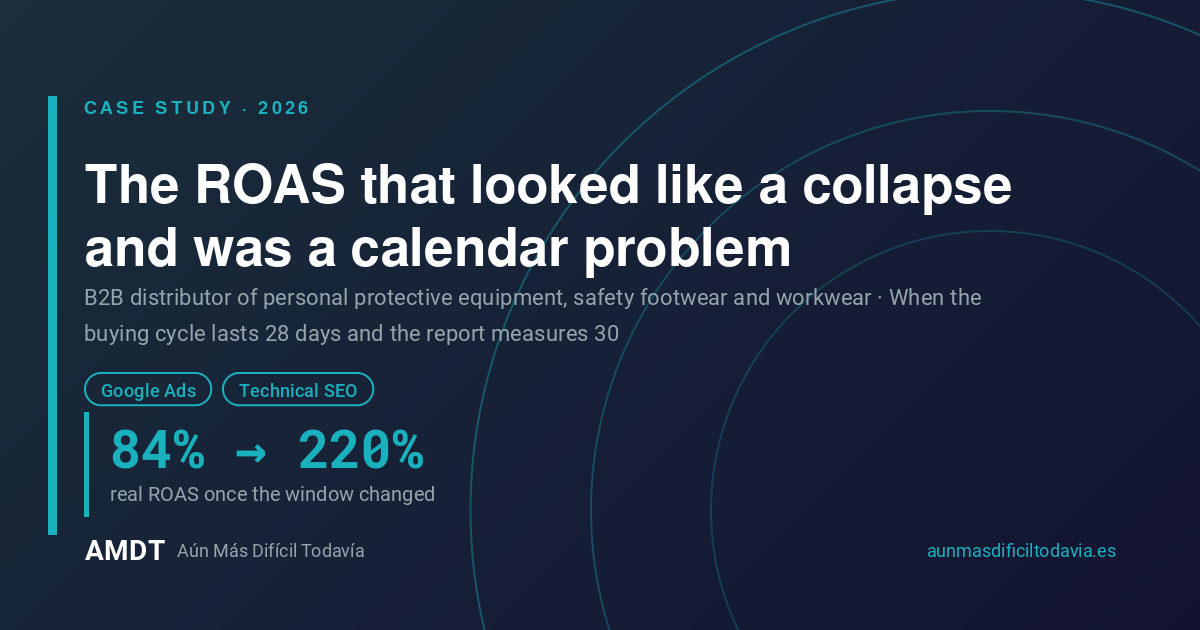
The ROAS that looked like a collapse but was actually a timing issue
B2B distributor of personal protective equipment, safety footwear and workwear · When the purchase cycle lasts 28 days and your report spans 30
June 2026. The automatic Google Ads report stated that the retailer’s return on investment had fallen to 84.1 per cent. With €9,486 invested, that meant losing money for every euro spent. Any management committee would have demanded an explanation, and rightly so.
The actual return for that same month was 220 per cent.
Not a single campaign had changed. What had changed was the measurement window. And therein lies, in my opinion, the most costly and widespread measurement error in Spanish B2B e-commerce. Let me explain 🙂
Let’s begin:
84% → 220%
Actual ROAS after changing the window
+309%
‘Add to basket’ in paid traffic
8-12s → 1.72s
mobile charging time
9.10 → 8.06
Average position following migration
1. The starting point: 264 campaigns and a 9.9% share of impressions
The client is a family-run company with seventy-seven years’ history in protection, safety and workwear. Its online shop sells safety footwear, personal protective equipment and workwear to businesses. When we reviewed the advertising account, this was the picture:
Google Ads audit covering the period December 2025 – March 2026:
- Overall account score: 4.2 out of 10.
- 264 campaigns created and 12 active. The rest were historical campaigns.
- ROAS of 1.08x with a cost per acquisition of €136.52.
- Search impression share of 9.9 per cent: for every hundred times someone searched for what the distributor sells, the advert appeared ten times. And of the missed opportunities, between 68 per cent and 71 per cent were due to position and quality, not budget.
- In GA4, the organic channel drove 20,714 sessions per month with zero recorded purchases, and desktop converted 2.6 times more than mobile.
- In the conversion funnel, only 5.5 per cent of those who viewed a product went on to add it to their basket.
A point of context worth bearing in mind, based on data from Semrush for April 2026 — a tool estimate, not measured data —: in a sector where specialist retailers were declining (the four comparable specialist retailers fell by between 11% and 37% year-on-year), the distributor was the only one to see growth in estimated organic traffic, up 29.3% year-on-year. The problem wasn’t demand. It was converting that demand into measurable business.
2. The finding: 28-day cycle, 30-day report
Why can’t a B2B e-commerce business be measured in the same way as a B2C one?
Because nobody buys fifty pairs of safety boots on the very same day they see the advert. A health and safety officer sees it, passes it on to the procurement department, procurement requests three quotes, someone signs off on it, and only then is the order placed. The client themselves estimated this cycle at 28 days.
By default, Google Ads attributes the conversion to the day it occurs. So, in a monthly report, you see June’s spend alongside sales closed in June, which largely stem from clicks in May. When spending rises, the apparent ROAS plummets. When it falls, it soars. It’s an accounting mirage.
That is why we have implemented a dual measurement system in the account: the standard metric, which is used for market comparisons, and the metric based on the time of conversion, which attributes the sale to the click that generated it. Both are always included in the same report.
I’ve seen perfectly healthy B2B accounts paused due to this misunderstanding. I recommend that, if your sales cycle exceeds fifteen days, you insist on this additional data in every report. It’s not a technicality: it’s the difference between scaling up a campaign or killing it.
3. What we did
Five parallel initiatives between February and July 2026:
- Restructuring and ongoing management of Google Ads: negative keywords, pausing inactive campaigns, adjusting tROAS per campaign, dedicated campaigns for three of the brands we represent, and monthly reports with dual attribution metrics.
- Shop migration: a redirect map created by cross-referencing the production crawl (22,721 URLs) with the development crawl (11,647), resulting in 1,359,301 rules covering primary matches, reverse navigation paths and manufacturer pages.
- robots.txt v2.0, which corrected a bot grouping error whereby the ‘Disallow’ directives were being overridden for Googlebot and AI crawlers. An invisible error with significant consequences.
- Post-launch technical QA: crawl of 13,853 URLs and live audit of JavaScript, Schema and Merchant Centre, with thirteen findings and fifteen corrections documented, including their code, the person responsible and the verification criteria.
- Content production: 152 SEO and AIO assets per URL, 145 categories prepared for upload to PrestaShop, 23 sector-specific texts and blog articles. The blog articles were verified as having 0% AI detection; for the sector-specific texts, the refinement process left all three corrected to between 0% and 5.6%.
4. The results
Paid advertising
| Metric | February 2026 | March 2026 | Source |
|---|---|---|---|
| Conversions | 26.72 | 55.29 (+107%) | Google Ads |
| ROAS | 47.2% | 99.2% | Google Ads |
| Cost per acquisition | €185.26 | €101.75 (−45%) | Google Ads |
| Add to basket (payment) | 76 (0.43%) | 311 (1.65%) | Clarity · measured |
| Shopping (payment) | 2 | 8 | Clarity · measured |
The jump from February to March is the clearest indication of the restructuring. In May, using conversion-time attribution, the account closed with 82 conversions and an ROAS of 258 per cent, with the PMAX campaign for one of the brands we represent achieving 474 per cent.
Migration and website performance
| Metric | Before | After | Source |
|---|---|---|---|
| Average organic ranking | 9.10 | 8.06 | GSC · measured |
| Organic CTR | 1.08% | 1.15% | GSC · measured |
| Home · average position | 11.5 | 4.7 | GSC · measured |
| Product data sheet · position | 7.57 | 6.30 | GSC · measured |
| Field LCP · mobile | 8-12 s | 1,720 ms | PageSpeed · measured |
| Mobile PageSpeed (home | 29-34 | 58 | PageSpeed · measured |
| Average order value (AOV) | €217.39 | €259.63 | GA4 · measured |
| Revenue (9 full days) | €16,643 | €17,655 | GA4 · measured |
Comparison of the ten days before and after the launch on 16 July 2026. The ‘9 clean days’ figure excludes the day of the launch. The average ticket value rose by 19.4% and revenue from the clean window by 6.1%.
Two further improvements are omitted from this table as they do not fall within the same window, and mixing them would be misleading: dead clicks fell from 24.4% to 5.84%, and JavaScript errors dropped by 24%. I suggest you apply this discipline to your reports: each figure should be confined to its own window.
And a third factor that is starting to make an impact: visibility in AI responses. In May 2026, the online shop had accumulated 154 mentions in Google’s AI Overviews in Spain, ranking third in its sector behind the top two players (273 and 263 mentions). Compared with its closest direct competitor, the ratio was 15 mentions to 2 in AI and 66.8 to 0.4 in brand awareness.
5. The tricky part of a migration
It’s clear that an e-commerce migration never comes free of charge, and this one was no exception. In the ten-day period following the launch, transactions fell compared with the previous ten days, with mobile conversion being the main area of concern.
The important thing is not that this happened — it almost always does — but that the cause was identified within forty-eight hours: JavaScript errors on the product page that specifically affected mobile behaviour, plus a data corruption issue in the analytics that rendered any channel breakdown unreliable until it was corrected.
Our assessment, quoted verbatim from the report: the migration was a technical success in terms of speed, architecture, indexability and search rankings, and had two active leaks. Both were named, with a person responsible and a target date.
On that basis, a checklist comprising twenty-four indicators was agreed with the client, each with its own baseline value and target: mobile conversion, measurement quality, error redirects, and response time to user interaction. When the outcome is verified with data, there is no room for interpretation — neither for us nor for anyone else.
To sum up: are you measuring, or are you just looking?
Essentially, what this project demonstrates is that in B2B, the attribution window isn’t a technical adjustment: it’s the difference between a profitable business and one that appears to be losing money.
If I were to take on a B2B account tomorrow, I’d do three things before adjusting a bid. First, I’d ask how many days pass between the first contact and the order, and I’d adjust the window to reflect that reality. Secondly, I’d put the standard data and the conversion-time data side by side in all reports, so that nobody has to choose which one to believe. And thirdly, I’d measure the funnel using a tool other than Google’s — in this case, Clarity — because that 0.43 per cent of items added to the basket was the real problem, and it didn’t appear in any advertising dashboard.
Remember, ultimately it’s all about ensuring your report’s timeline matches your customers’ timeline 😉

