
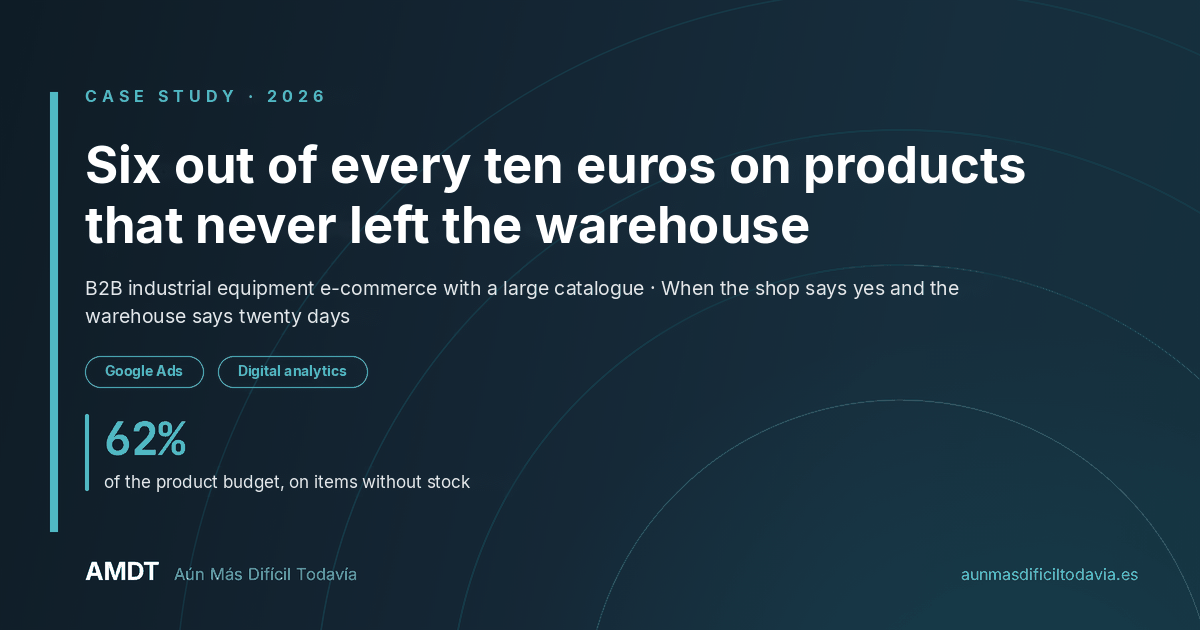
Case study
Six out of every ten euros on products that never left the warehouse
B2B industrial equipment e-commerce with a large catalogue · When the shop says yes and the warehouse says twenty days
Advertising a product that cannot be shipped costs exactly the same as advertising one that can. Google does not charge you less for it.
Over ten months, this shop invested €50,716.60 in advertising that we were able to track product by product. Of that amount, €31,448.07 (62%) went on items that today have no stock or have fewer than half of their variants available.
And the catalogue was not lying.
All of those products could be bought. The product page was live, the button worked, the order went through without a single error. The catch was something else: delivery took a median of twenty days. Let me explain 🙂
Let’s start:
62%
of the product budget, on items without stock
16.530 €
invested in products that did not sell a single unit
1.73 vs 0.30
ROAS with stock versus ROAS on back order
3.9 times
lower conversion without stock, even without advertising
1. The starting point: a catalogue that said yes to almost everything
The shop had 2,427 products published and 14,152 variants across them. Drilling down into each variant, this was the picture:
- 2,722 variants with units in the warehouse. 19.2% of the catalogue. Immediate dispatch.
- 10,321 variants out of stock but available to buy. 72.9%. The customer pays and waits.
- 1,109 variants neither in stock nor available to buy. 7.8%. The product page exists; the sale does not.
Look at the second group, because that is where all the money was. Seven out of every ten variants in the catalogue accepted orders without having anything in the warehouse.
On paper, that is a competitive advantage. A deep catalogue without tied-up stock.
On the ground, it turned out to be something else.
And it was no small problem: of the 436,959 visits the product pages received during the period, 173,663 (39.7%) went to products without a single available variant. Four out of every ten visits to a product page ended on something that was not there. It is the first figure we ask for in any e-commerce consultancy project: not how many people come into the shop, but how many available products they land on.
It is like a fourteen-page restaurant menu where the waiter keeps telling you, dish by dish, that it is not available today. By the third one, you stop asking: you get up and leave.
2. The finding: being able to order it is not the same as being able to sell it
Here it is worth separating two things that almost everyone mixes up, without confusing apples and oranges: a product being available to buy and a product being available to ship. The shop had solved the first one impeccably. Not the second.
And how much does that difference cost? It can be put in euros.
In the last five months of the period analysed, the return on investment for products in stock was 1.73. For products out of stock that could still be ordered, with a delivery date and everything, it was 0.30.
Almost the same as products that simply cannot be bought.
The split of spend by availability, over the full ten months, leaves little room for interpretation:
| Product status | Investment | Without a single sale | % without a sale |
|---|---|---|---|
| Full stock | 11.295,82 € | 1.444,60 € | 12,8% |
| Partial stock | 7.972,71 € | 479,46 € | 6,0% |
| Most variants out of stock | 8.308,13 € | 2.353,32 € | 28,3% |
| Out of stock, back order with a date | 20.384,93 € | 11.964,87 € | 58,7% |
| Out of stock, lead time on request | 2.566,82 € | 2.187,10 € | 85,2% |
| Out of stock, not available to buy | 188,20 € | 47,97 € | 25,5% |
Read it from top to bottom and you will see the curve. With the warehouse full, six out of every hundred euros go without a sale. With the warehouse empty but the product page live, almost six out of every ten.
The “back order with a date” group took 40.2% of the entire product budget. It was, by far, the biggest recipient of the investment. And the worst performer.
Clearly, a broad catalogue helps to capture demand. What these numbers say is that capturing demand and fulfilling it are not the same budget line.
3. The proof that the problem was not the advertising
At this point, the convenient explanation was ready and waiting: the ads are being shown to the wrong people. Targeting, bids, audiences. Fix it in Google Ads and move on.
That is why we ran the check that rules out that hypothesis: measuring conversion channel by channel, including the channels where not a single euro is spent on advertising.
| Channel | Conversion with stock | Conversion without stock |
|---|---|---|
| Paid | 0,80% | 0,15% |
| Organic | 1,14% | 0,30% |
| Direct | 4,31% | 1,42% |
| 4,91% | 0,89% | |
| Total | 1,75% | 0,45% |
Look at the direct traffic row. A user who types the shop’s address into the browser, who already knows it, who probably has an account and has bought before, converts three times less when the product is not in stock.
In organic, almost four times less. And there is no bid to adjust there.
Can you see the difference? If the problem were who sees the ad, traffic that arrives without an ad should not be affected. It is affected just the same. Availability is not a campaign variable: it is a business variable that the campaign merely amplifies.
The figure that struck me most was this one: there was a set of products that gathered 143,151 visits in ten months and zero orders through any channel. 69% of those visits came through channels with no advertising cost (43% organic and 17% direct). Advertising paid €16,530.58 to bring people to that same place.
I have seen plenty of accounts where the problem was in the account. This was not one of them, and you can only see that if digital analytics and advertising are looked at in the same table.
4. How the data was built
Remember when checking availability meant opening the product page and seeing whether it said “available”? That was our first attempt, and it is where the methodological error worth telling lies.
The live product page answers a yes-or-no question: can it be bought or not. It does not say how many units there are, whether the product accepts sales without stock, or when it will arrive. And in a catalogue where 72.9% of variants accept orders without having anything in the warehouse, that yes-or-no question answers yes practically every time.
That is why the analysis was built on three cross-referenced sources, not on the product page:
- The shop’s full catalogue, variant by variant: actual units and whether each one allows sales without stock. That produces the four statuses (in stock, back order with a date, lead time on request and not available to buy) that structure the whole analysis.
- Behavioural analytics, with the visits and orders for each product page broken down by channel, so we could look at conversion where there is no investment.
- The advertising account, with spend attributed product by product. 71% of the account’s budget could be assigned to a specific product page; the rest is inventory that does not show a product and cannot be read this way.
A check I always like to do: test the new method against the old one. Reading the product pages gave 19.4% of variants in stock and the catalogue gave 19.2%. Two different routes, practically the same number. When that happens, you can trust the big figure.
You also have to clean up. We excluded from the count 56 orders from internal traffic and test environments, with almost €50,000 of associated revenue. That left 2,255 real orders. I recommend always doing that subtraction before calculating any conversion rate: it is boring and it changes the result.
What is the limit of this analysis?
That availability is a snapshot of one specific month and the spend covers ten. Cross-referencing the two is indicative, not conclusive: nobody can claim that in January money was spent on a product that was out of stock in January.
I say this because it is the right objection, and it needs to be put on the table before the client raises it.
The answer lies in looking at the most recent month, where the catalogue snapshot and the spend do coincide in time.
The trend is not noise. It is a drift.
5. What we did
Four measures, all applied to the Google Ads account and to the shop itself, and none of them involves spending less:
- Removing unshippable products from the feed. Items without stock and without a committed delivery date are no longer advertised. They were the worst performers of all: 85.2% of their investment went without a single sale.
- Tagging the feed by actual availability. Each product now carries a label with its warehouse status, so the bid can depend on whether the item ships today or in three weeks. Without that label, the bidding system treats both the same.
- Reallocating the budget towards what leaves the warehouse. The full-stock and partial-stock groups accounted for only 38% of the investment and were the only two with waste below 13%.
- Delivery times shown on the product page, and a review of those lead times with the purchasing team. Because half of the problem is marketing and the other half is not. Of all the back-order variants in the catalogue, only six arrived in less than a week.
That last point is usually the hardest one in a meeting, and it is the one that matters most. An advertising analysis that ends with “the restocking times need reviewing” goes beyond an agency’s usual remit.
We believe that is exactly where it should end.
6. What we do not know yet
The four measures have only recently been put in place and the result has not been measured. Writing a savings figure here would mean making it up, so you will not find one.
What there is, though, is a starting point to compare against. These are the indicators we are tracking, with their starting values:
- Percentage of the product budget on items that cannot be delivered within seven days: 47.3% in August.
- Return on investment by availability group: 1.73 in stock versus 0.30 on back order.
- Investment without any associated sale: €18,477.31, 36.4% of everything invested in products.
- Conversion for products with a published delivery date, to find out whether showing the lead time helps or puts people off.
And a piece of honesty worth putting in writing: removing a product that cannot be supplied from the feed does not automatically generate a sale on another. Part of that €16,530 is reinvested and part simply stops being spent. Which is which will be revealed by next quarter, not by me now.
In short: is your budget paying for the shop window or for deliveries?
Essentially, what this project shows is that product availability is not a logistics matter far removed from marketing: it is the variable that best explains the return on advertising investment for a shop with a deep catalogue.
If I started an e-commerce consultancy project tomorrow with a large catalogue, I would do three things before looking at a single bid.
First, I would take availability from the catalogue rather than from the product page, variant by variant, with the actual units in front of me. Second, I would cross-reference that status with last month’s spend, not last year’s, because the only snapshot that helps you decide today is today’s. And third, and this is what really settles the argument, I would look at conversion in the channels without advertising: if organic and direct traffic also convert poorly on those products, the problem is not in the campaign and no optimisation will fix it.
I know that reviewing fourteen thousand variants does not sound like exciting work. Almost none of the decisions that save money do.
I suggest starting with a simple question that almost no shop has answered: of everything you advertise today, what percentage could be at your customer’s door next week?
Remember, in the end it all comes down to being able to ship what you advertise 😉

